
Index provides flu risk for each state
New model can better equip public health officials to address outbreak risks unique to their region

Infectious disease can afflict a population in complex ways but understanding those varying risks is an equally complex challenge.
The Centers for Disease Control and Prevention (CDC) offers a general metric for assessing the risk of natural disasters in a region in terms of Social Vulnerability Index (SVI), which includes socio-economic and cultural factors that impact how a region can adapt to a disaster. Researchers at Washington University in St. Louis wanted to take a more specific approach for assessing a state’s risk for influenza-like illness (ILI).
Their work, now published in the journal PLOS Computational Biology, provides a state-level vulnerability map revealing significant regional disparities between what states are at higher risk for infection.
“This approach considers the relative importance of the many socioeconomic and health factors within a defined area,” said Rajan Chakrabarty, the paper’s senior author and the Harold E. Jolley Professor of Engineering at the McKelvey School of Engineering.
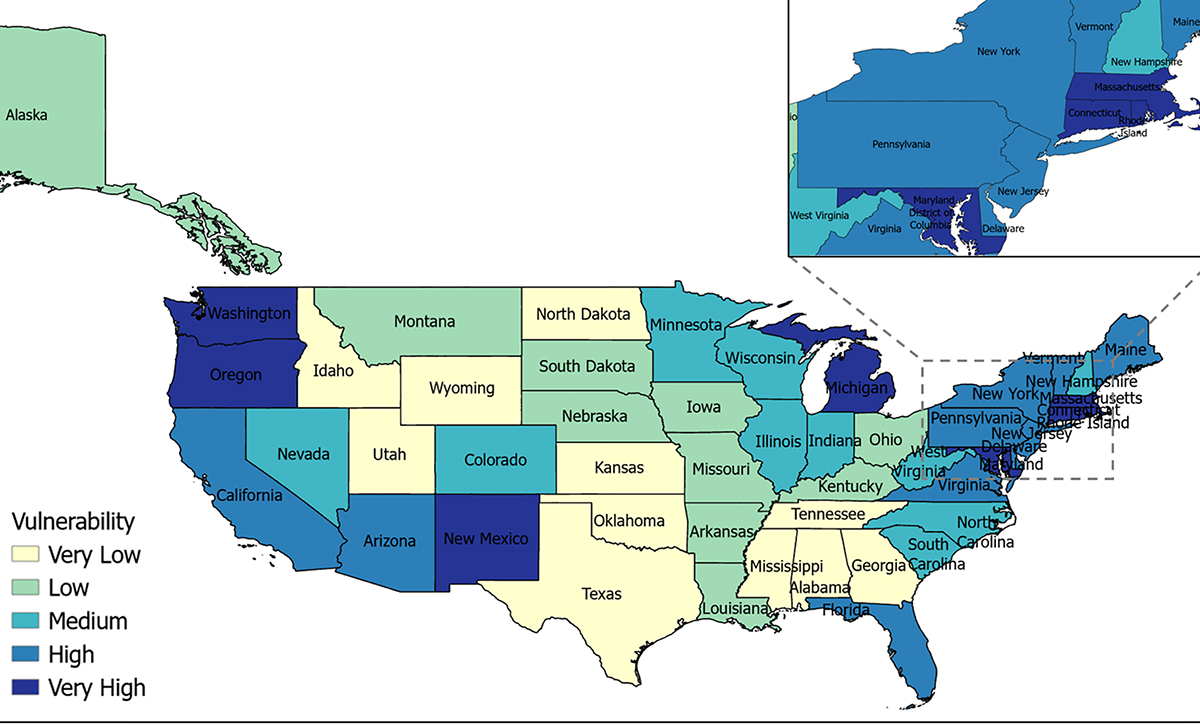
Researchers at WashU have put together state-level Influenza-like illness vulnerability map highlighting regions with varying levels of vulnerability to infectious disease outbreaks. Dark blues are areas more vulnerable because complex socio-economic, geographic and health factors including insurance rates, density of the population, and poverty rates. (Image: AIR lab)
He added that the index can provide vulnerability “hotspots” in the U.S. so that policy makers can develop better targeted strategies to prevent the spread of flu.
Unlike previous models that mostly rely on health data for determining a region’s disease risk, Chakrabarty’s team used machine learning algorithms that can crunch census data and determine the non-linear relationships between socioeconomic factors, health indicators and vulnerability to flu. All told, they integrated 39 socio-economic and health indicators from U.S. Census data including factors like migration patterns, insurance coverage and proportions of women and elderly populations.
“Vulnerability does not come from a single factor but is shaped by urbanization, demographics, health care access, and economic disparities,” Chakrabarty said.
Some places may need to better understand the combined effect of different socio-economic factors on disease spread, like in more dense metros with high number of foreign-born populations. Other places may need to connect neglected rural population to insurance and health care or providing poverty relief programs that link vulnerable groups to healthcare access. All states will likely need to do “all the above” in some form but put extra resources where targeted interventions might make the biggest difference.
For example, the District of Columbia, is the most “at risk” region in part because it is characterized by high population density and mobility (causing easy spread of viruses), and increased risks due to a sizable uninsured foreign-born population and longer commute times. In contrast, states with large rural regions such as New Mexico and Arizona also exhibit heightened flu vulnerability but due to different factors, like the higher numbers of aging, women and Hispanic people, a population more at risk for flu complications.
Each state has its own unique “fingerprint” of risk factors, neatly mapped out in the research. Michigan is another high-risk state because of its mix of urban and rural regions, so it faces dual challenges — high transmission risks in cities and economic hardships in rural areas, noted Shrabani Sailaja Tripathy, a postdoctoral associate in Chakrabarty’sAerosol Interdisciplinary Research (AIR) lab and lead author of the research.
Every state has a complicated picture, but policy makers now have a new tool that can apply to any infectious disease.
“This can help strengthen our epidemic preparedness and response,” Chakrabarty said.
Tripathy SS, Puthussery JV, Kapoor TS, Cirrito JR, Chakrabarty RK (2026) Spatial variation in socio-economic vulnerability to Influenza-like Infection for the US population. PLOS Computational Biology 22(1): e1013839. https://doi.org/10.1371/journal.pcbi.1013839
This work was supported, in whole or in part, by Flu Lab.
Click on the topics below for more stories in those areas
Back to NewsFaculty in this story

Rajan Chakrabarty

Shrabani Sailaja Tripathy
Postdoctoral associate
In the Media
Earth.com: Map reveals which U.S. states are most vulnerable to flu outbreaks